
1
Please refer to important disclosures at the end of this report
1
1
Angel Top Picks – May 2020
Market recovers in April as FPI outflows slow down – Post sharp correction in
Mar’20 due to rapid spread of Covid – 19 globally sentiments turned positive in
April due to intervention by global central banks who pumped in unprecedented
liquidity from the second half of March. As a result FPI outflows from india abated
significantly in April to `6,884 cr. as compared to `61,973 cr. in March 2020.
Global lockdowns have slowed the spread of Covid – 19 – Rapid spread of Covid
– 19 globally had led to Governments resorting to unprecedented measures
including nationwide shutdowns across the world including Europe and India,
while the US issued strict social distancing guidelines. The global lockdowns have
clearly slowed the spread of the Covid – 19 as daily net new additions have slowed
down significantly by the end of April and most of the countries are formulating
exit strategies and are in the midst of restarting their economy gradually.
Government and central banks have responded with unprecedented stimulus to
counter the economic fall out – Though lockdowns have slowed the spread of the
virus it has come at a significant economic cost. Central banks and Governments
globally have responded with unprecedented monetary and fiscal stimulus in the
aftermath of Covid 19 in order to contain the economic damage. The US Fed has
pumped in record USD 2.5tn into the economy through its quantitative easing
program in the past two months while most Governments globally have also
announced significant fiscal packages.
Calibrated opening of economies to be the norm giver fear of outbreak – Though
most of the countries including India are now opening up their economies, it is
being done in a slow and calibrated manner given fear of a second outbreak if
economies are opened up too fast. So far there has been a mixed result with
China leading the way as not only have they been able to bring the outbreak
under control but have been able to reopen a significant part of their economy.
Singpore on the other hand reported a surge in new infections in the middle of
April and had to resort to a lockdown in order to bring down new cases.
High quality businesses to out-perform in difficult market environment - The Indian
Government has announced an extension of the lowdown till the 17
th
of May
though with reasonable relaxations. The proactive measure by the Indian
Government to shut the economy early has so far prevented a widespread Covid -
19 epidemic. However opening up of the economy is coinciding with acceleration
in new cases which is a cause for worry. Therefore given the increasing
uncertainties on the domestic front we would recommend to avoid vulnerable
sectors and invest in high quality business in 3-4 tranches.
Top Picks Performance
Return Since Inception (30th Oct, 2015)
Top Picks Return
36.2%
BSE 100
14.1%
Outperformance
22.1%
Source: Company, Angel Research
Top Picks
Company
CMP (`)
TP (`)
FMCG
Colgate-Palmolive
1,343
1,772
Nestle India
17,420
20,687
P&G Hygiene
10,063
12,230
Britannia Industries
2,978
3,550
Other Consumer Goods
Avenue Supermarts
2,205
2,735
Bata India
1,266
1,561
Hawkins Cookers
4,956
6,200
Healthcare & Pharma
IPCA Laboratories
1,575
1,900
Alkem Laboratories
2,670
3,300
IT
Infosys
675
841
L&T Infotech
1,529
1,803
Chemicals/Agrochemicals
PI Industries
1,529
1,785
Galaxy Surfactants
1,356
1,610
Aarti Industries
1,138
1,284
Dhanuka Agritech
434
520
Telecom/Others
Bharti Airtel
528
594
Reliance Industries
1,461
1,626
Source: Company, Angel Research
Note: Closing price as on 5th May,2020

2
Error!
Refer
ence
sourc
Angel Top Picks | May 2020
May 7, 2020
2
Top Picks
3
Error!
Refer
ence
sourc
Angel Top Picks | May 2020
May 7, 2020
3
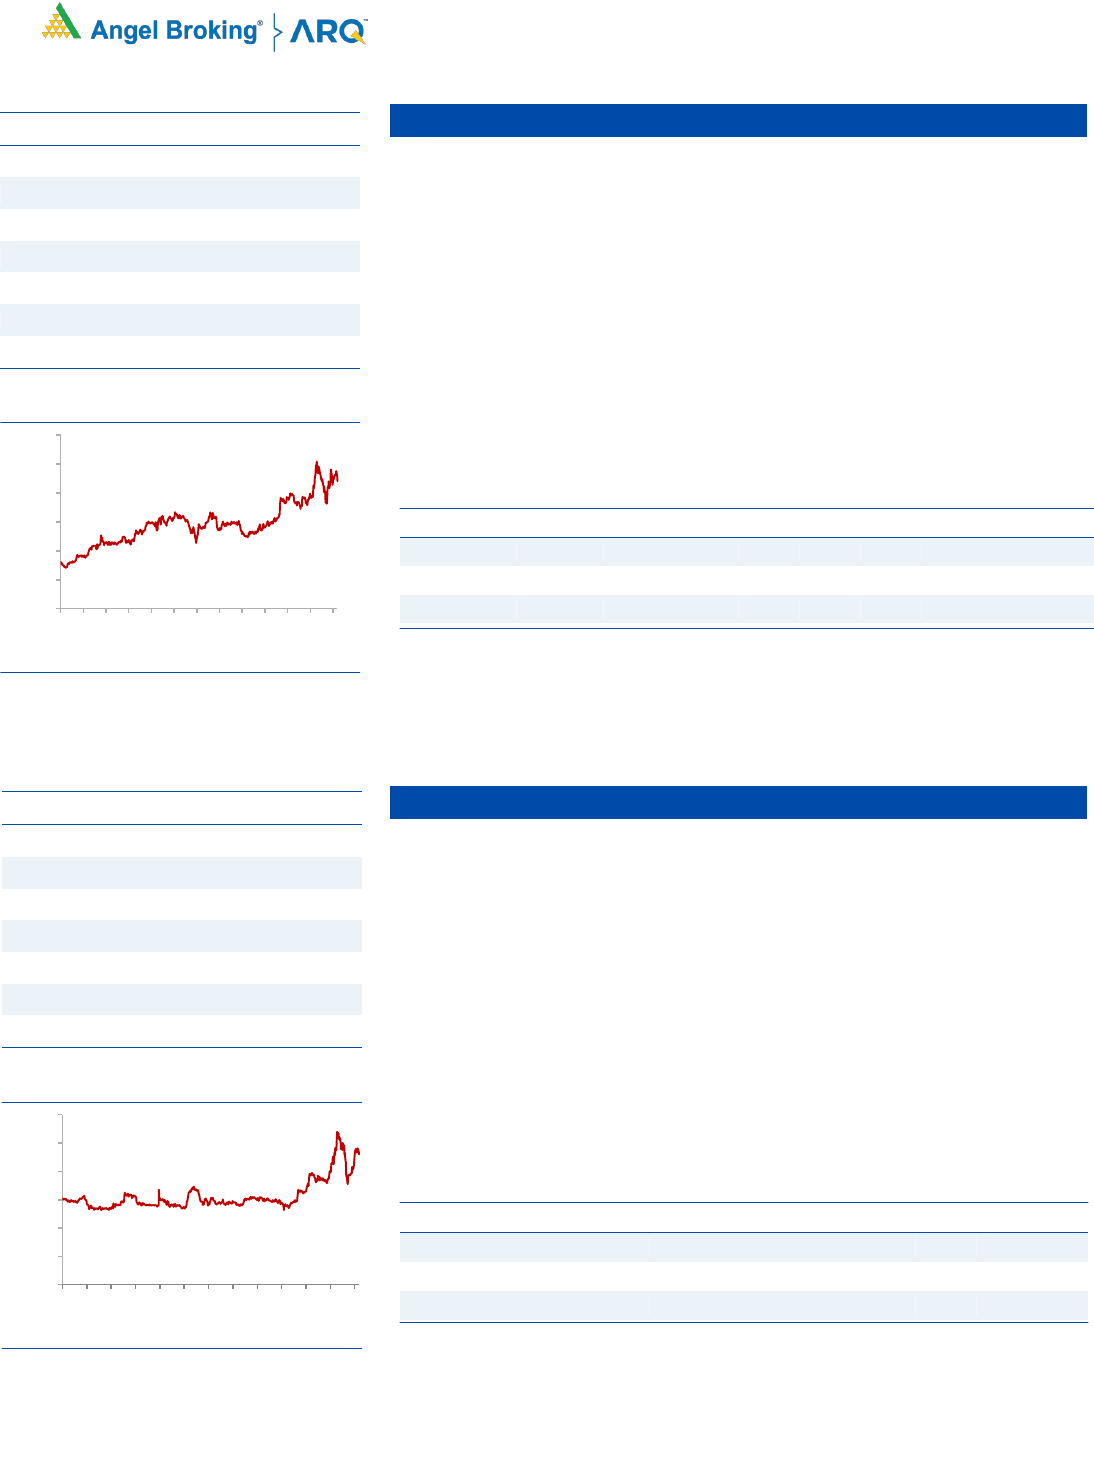
Avenue Supermarts
Avenue Supermarts owns and operates the supermarket chain ‘D-MART’.
Focused on value retailing, it offers a wide range of fast-moving consumer
(food and non-food) products, general merchandise and apparel.
Currently, the company has 196 D-MART stores and it expects to open 30
stores every year through its cluster approach.
DMART offers significant discount compared to e-commerce, Modern trade
(~6%) and General trade (~18%), which would drive revenue growth.
Operating margin is higher compared to its peers due to the company’s low
cost structure.
We expect DMART to report consolidated revenue/PAT CAGR of 18%/26%,
respectively over FY2019-22E.
Key Financials
Y/E
Sales
OPM
PAT
EPS
ROE
P/E
P/BV
EV/Sales
March
(` cr)
(%)
(` cr)
(`)
(%)
(x)
(x)
(x)
FY2021E
27208
9.0
1470
23.6
17.5
87.8
17.6
5.5
FY2022E
33238
9.0
1800
28.8
17.7
71.7
14.5
4.5
Source: Company, Angel Research
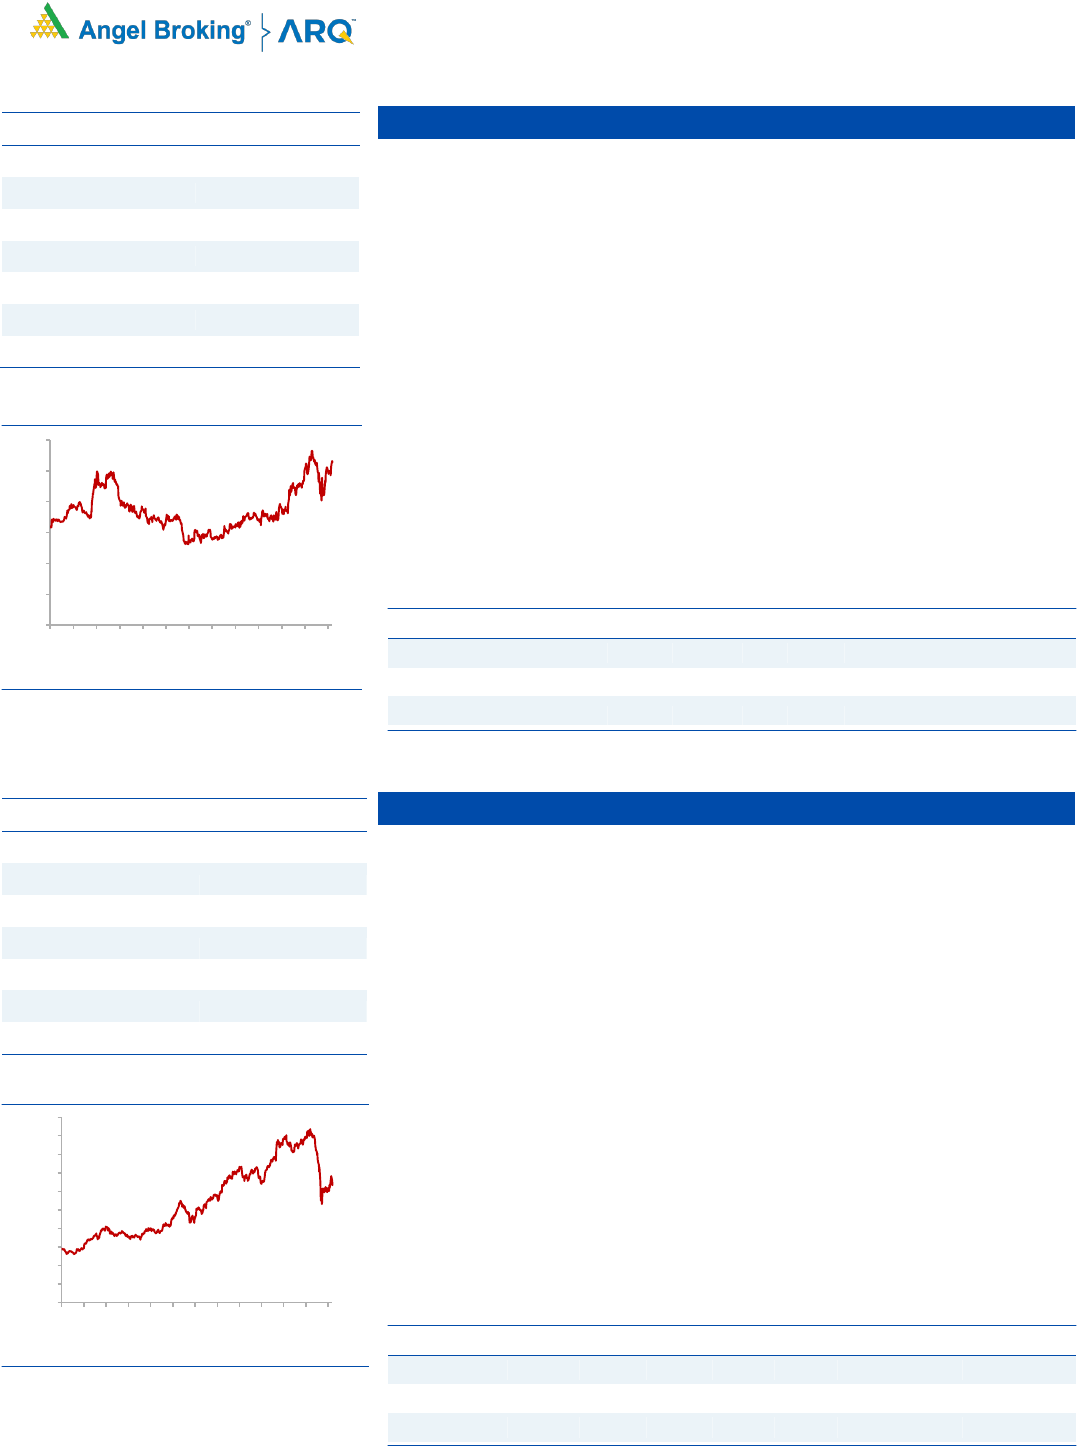
Hawkins Cookers Ltd
Hawkins Cookers Ltd (HCL) operates in two segments i.e. Pressure Cookers
and Cookware. Over the last two years, the company has outperformed TTK
Prestige (market leader) in terms of sales growth ~13% vs. ~4% in Cookers &
Cookware segment.
Cooking gas (LPG) penetration has increased from 56% in FY2014 to 80% in
FY2019, which would drive higher growth for Cookers & Cookware compared
to past.
Going forward, we expect HCL’s margins to improve 80-100bps on the back
of falling raw material prices and also because the company had already
taken a price hike previously.
Key Financials
Y/E
Sales
OPM
PAT
EPS
ROE
P/E
P/BV
EV/Sales
March
(` cr)
(%)
(` cr)
(`)
(%)
(x)
(x)
(x)
FY2021E
768
15.1
82
154.2
45.0
30.4
13.7
3.2
FY2022E
876
15.1
94
177.0
42.2
26.4
11.2
2.8
Source: Company, Angel Research
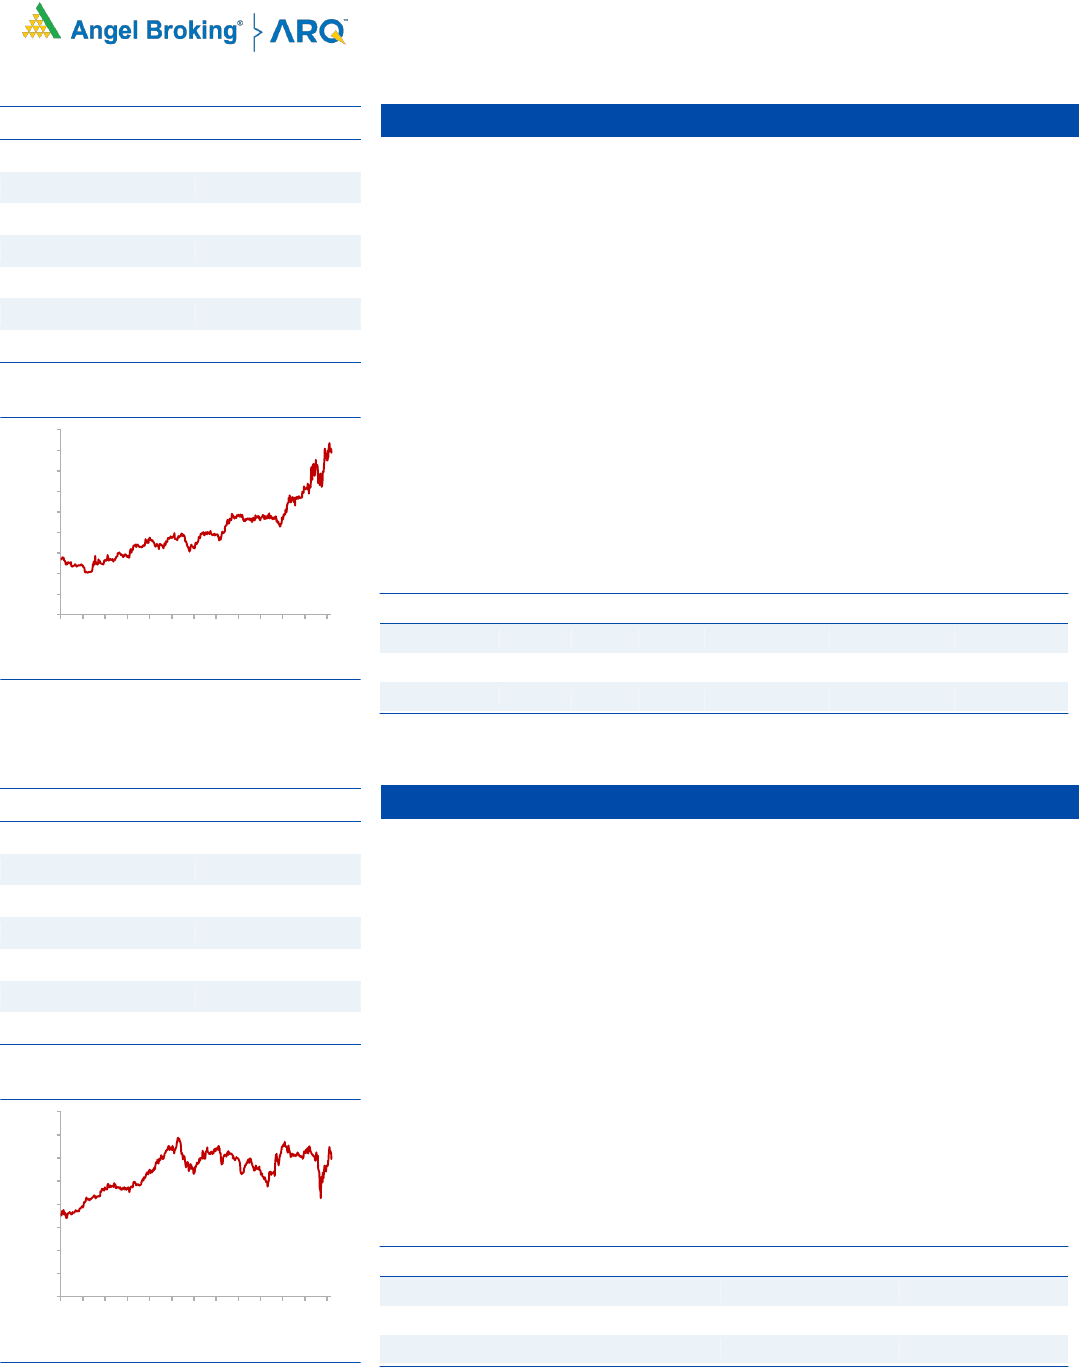
Stock Info
CMP
2,205
TP
2,735
Upside
24.0%
Sector
Retail
Market Cap (` cr)
142,847
Beta
0.8
52 Week High / Low
2,560/1,226
3 year-Chart
Source: Company, Angel Research
-
500
1,000
1,500
2,000
2,500
3,000
May-17
Aug-17
Oct-17
Jan-18
Apr-18
Jul-18
Oct-18
Jan-19
Apr-19
Jul-19
Oct-19
Jan-20
Apr-20
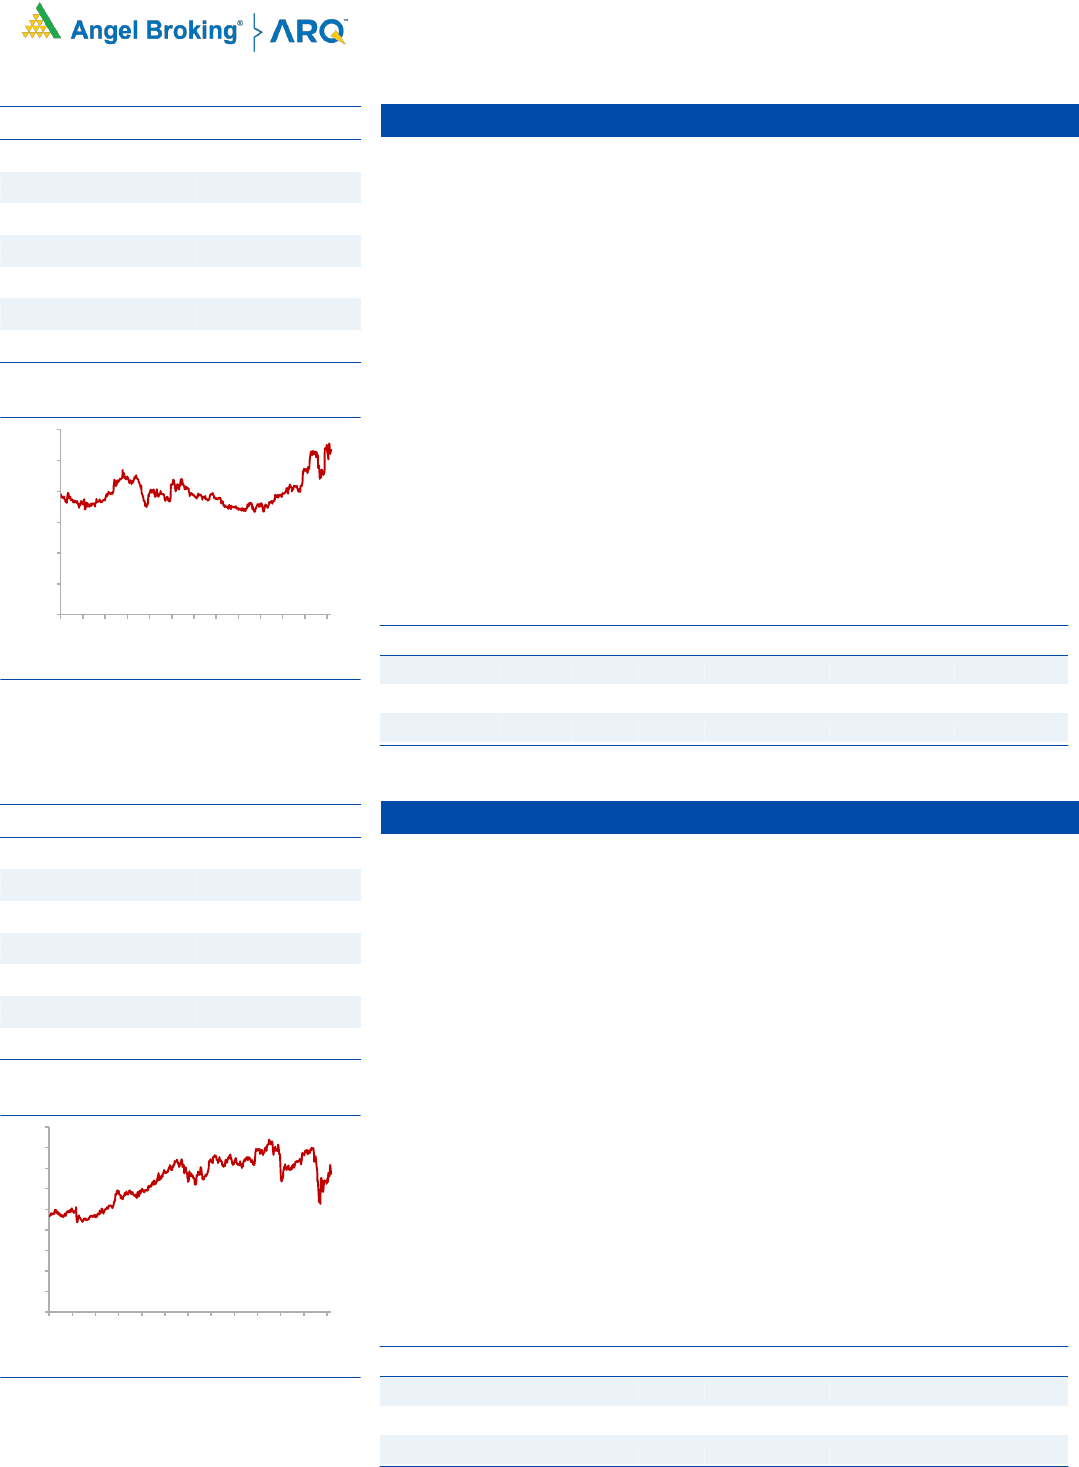
Stock Info
CMP
4,956
TP
6,200
Upside
25.1%
Sector
Houseware
Market Cap (` cr)
2,440
Beta
0.7
52 Week High / Low
5,539/2,606
3 year-Chart
Source: Company, Angel Research
-
1,000
2,000
3,000
4,000
5,000
6,000
May-17
Aug-17
Oct-17
Jan-18
Apr-18
Jul-18
Oct-18
Jan-19
Apr-19
Jul-19
Oct-19
Jan-20
Apr-20
4
Error!
Refer
ence
sourc
Angel Top Picks | May 2020
May 7, 2020
4
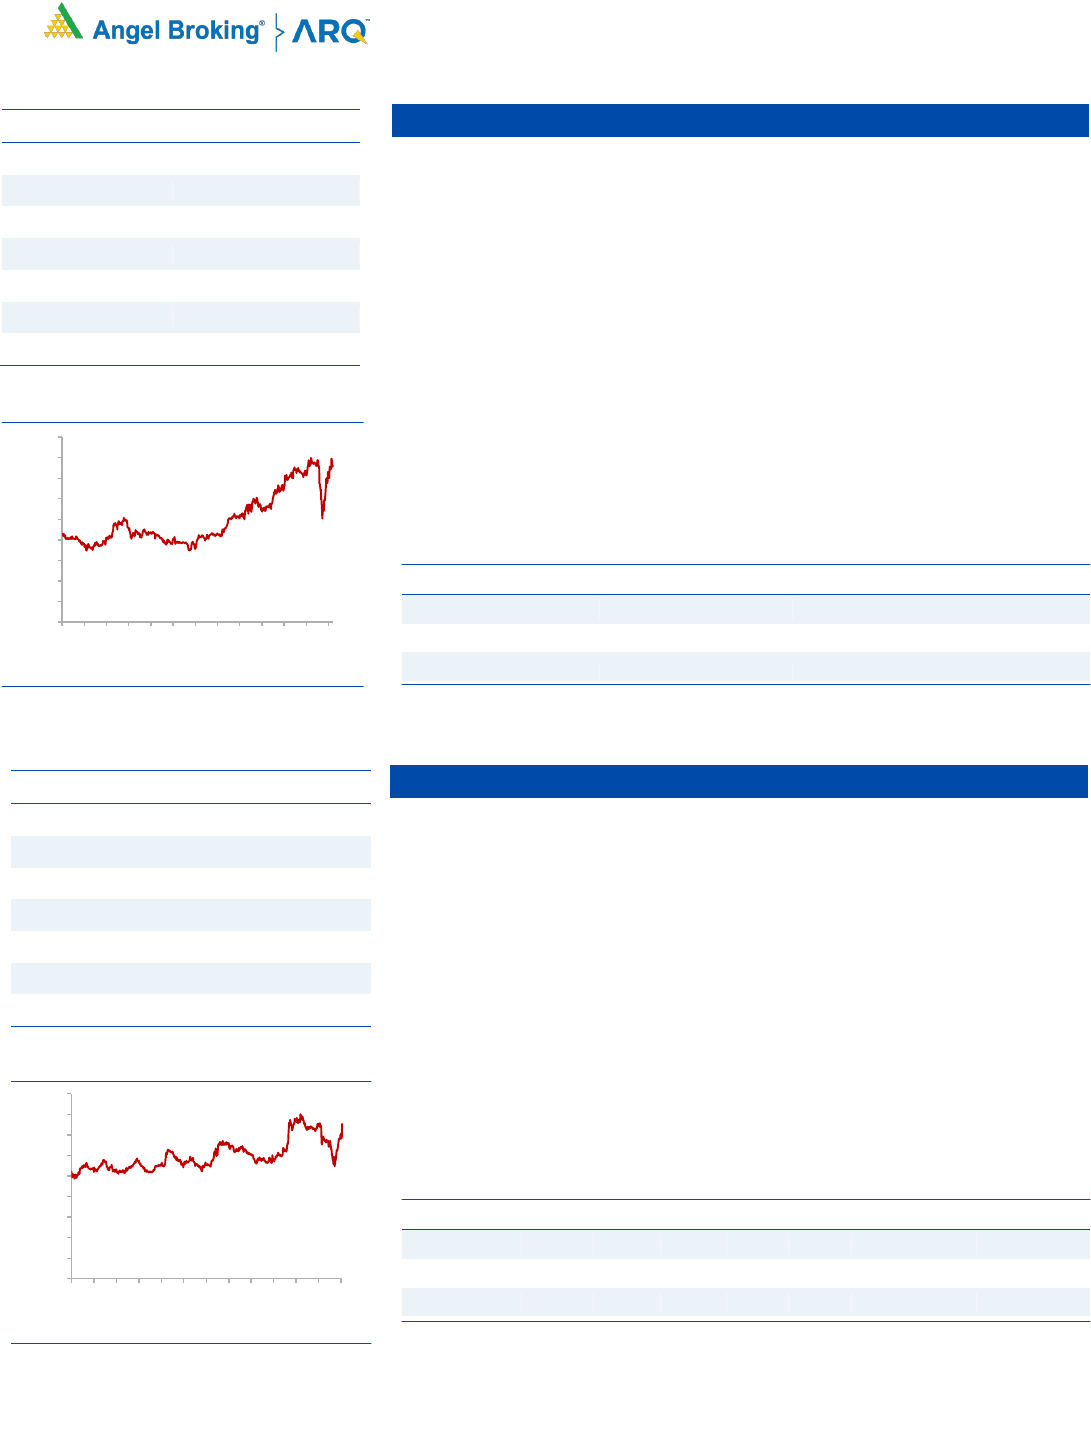
Bharti Airtel
There is going to be some impact on subscribers from the low income group
especially daily wage earners due to the lockdown. However a sharp increase
in data consumption should make up for a significant portion of the loss.
Therefore we expect limited impact on Bharti from the lockdown.
Bharti has raised capital of USD 2bn from a QIP at `445 per share along with
FCCB issues of USD 1bn in January 2020. Therefore Bharti is much better
placed as compared to Vodafone Idea in terms of liquidity.
Telecom operators have increased tariffs by ~35% in Nov’19. There is a
possibility of another round of tariff hikes by telecom companies in FY21 given
that tariffs are still very low. If this were to happen then it would lead to further
upsides to our estimates for FY21 and FY22.
Even if there is no major tariff hike in FY21 and Vodafone Idea goes out of
business, Bharti would benefit significantly from addition of subscribers.
Key Financials
Y/E
Sales
OPM
PAT
EPS
ROE
P/E
P/BV
EV/Sales
March
(` cr)
(%)
(` cr)
(`)
(%)
(x)
(x)
(x)
FY2021E
99530
44.4
4405
6.1
3.7
79.5
2.9
3.3
FY2022E
111755
45.6
8171
12.7
7.1
38.5
2.7
2.8
Source: Company, Angel Research
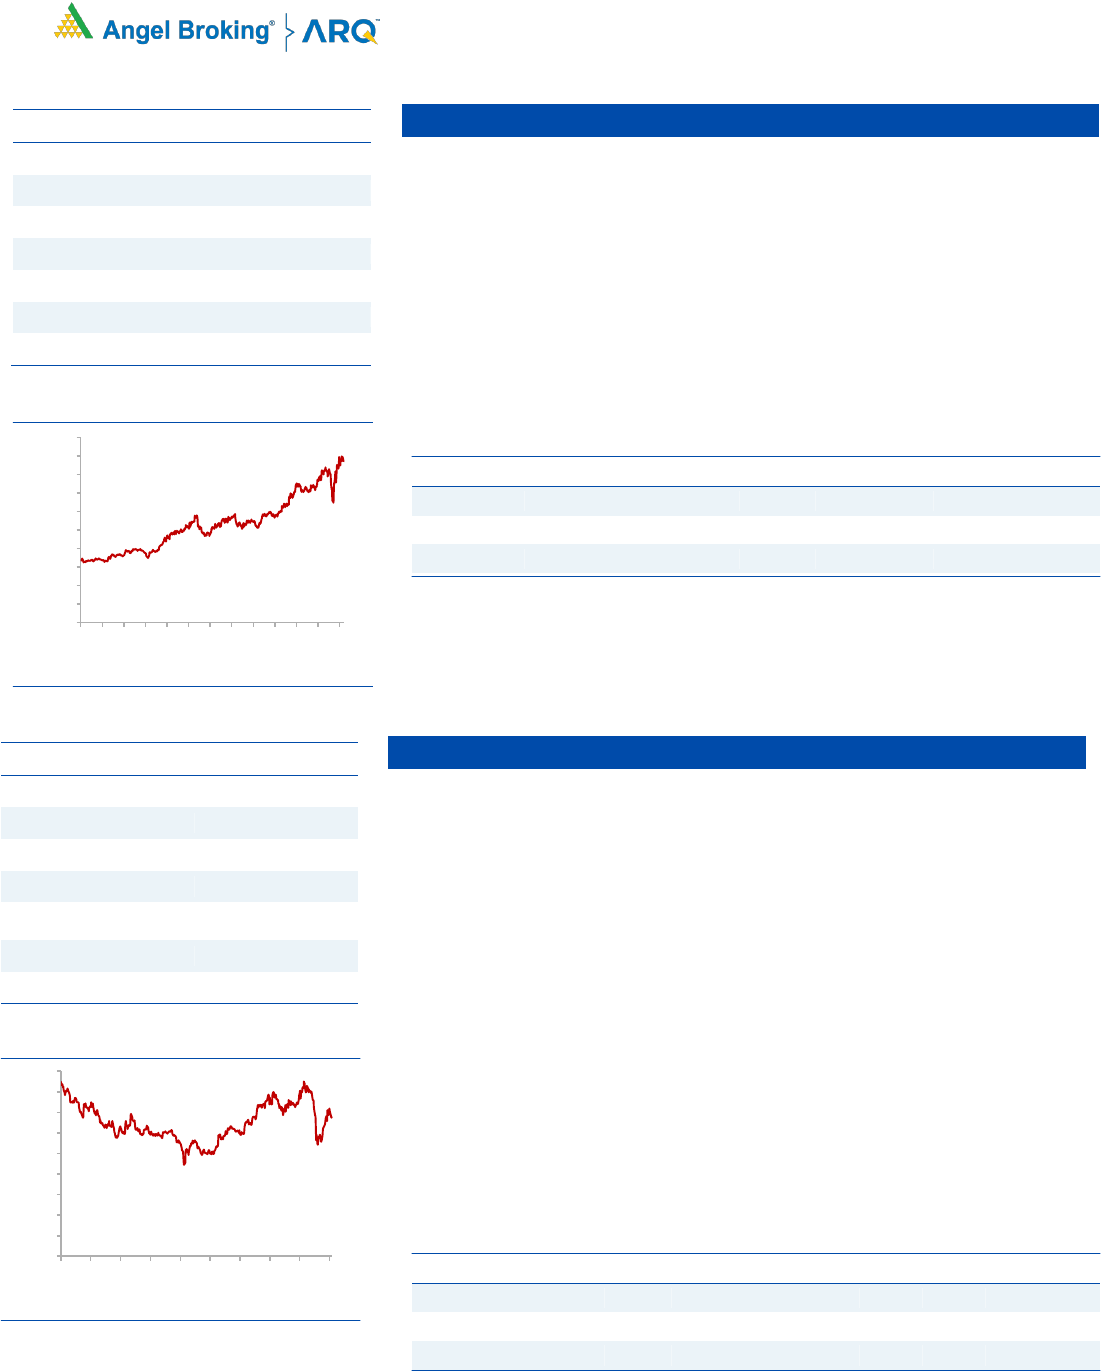
Bata India
The Indian footwear industry is valued at `50,000-55,000, which is expected
to grow at a CAGR of ~15% going ahead. Two third of the industry is mainly
dominated by the unorganized sector which suggest huge untapped
opportunity.
Strong retail stores expansion plan to boost growth (500 stores for next 5
years).
Currently, women’s footwear segment accounts for ~30-35% of Bata sales,
which the company is targeting to increase to ~40% over the 3 years.
Currently, Bata’s 35-40% sales come from premium products like Hush
Puppies, Power, Marie Clarie, etc. Bata has plans to increase premium
product sales from current level of total revenue over next two years
Stock has corrected significantly from peak, providing good buying
opportunity.
Key Financials
Y/E
Sales
OPM
PAT
EPS
ROE
P/E
P/BV
EV/Sales
March
(` cr)
(%)
(` cr)
(`)
(x)
(%)
(%)
(x)
FY2021E
3359
27.7
434
33.8
17.9
38.9
6.9
4.5
FY2022E
3762
27.7
518
40.3
18.1
32.6
5.9
3.9
Source: Company, Angel Research
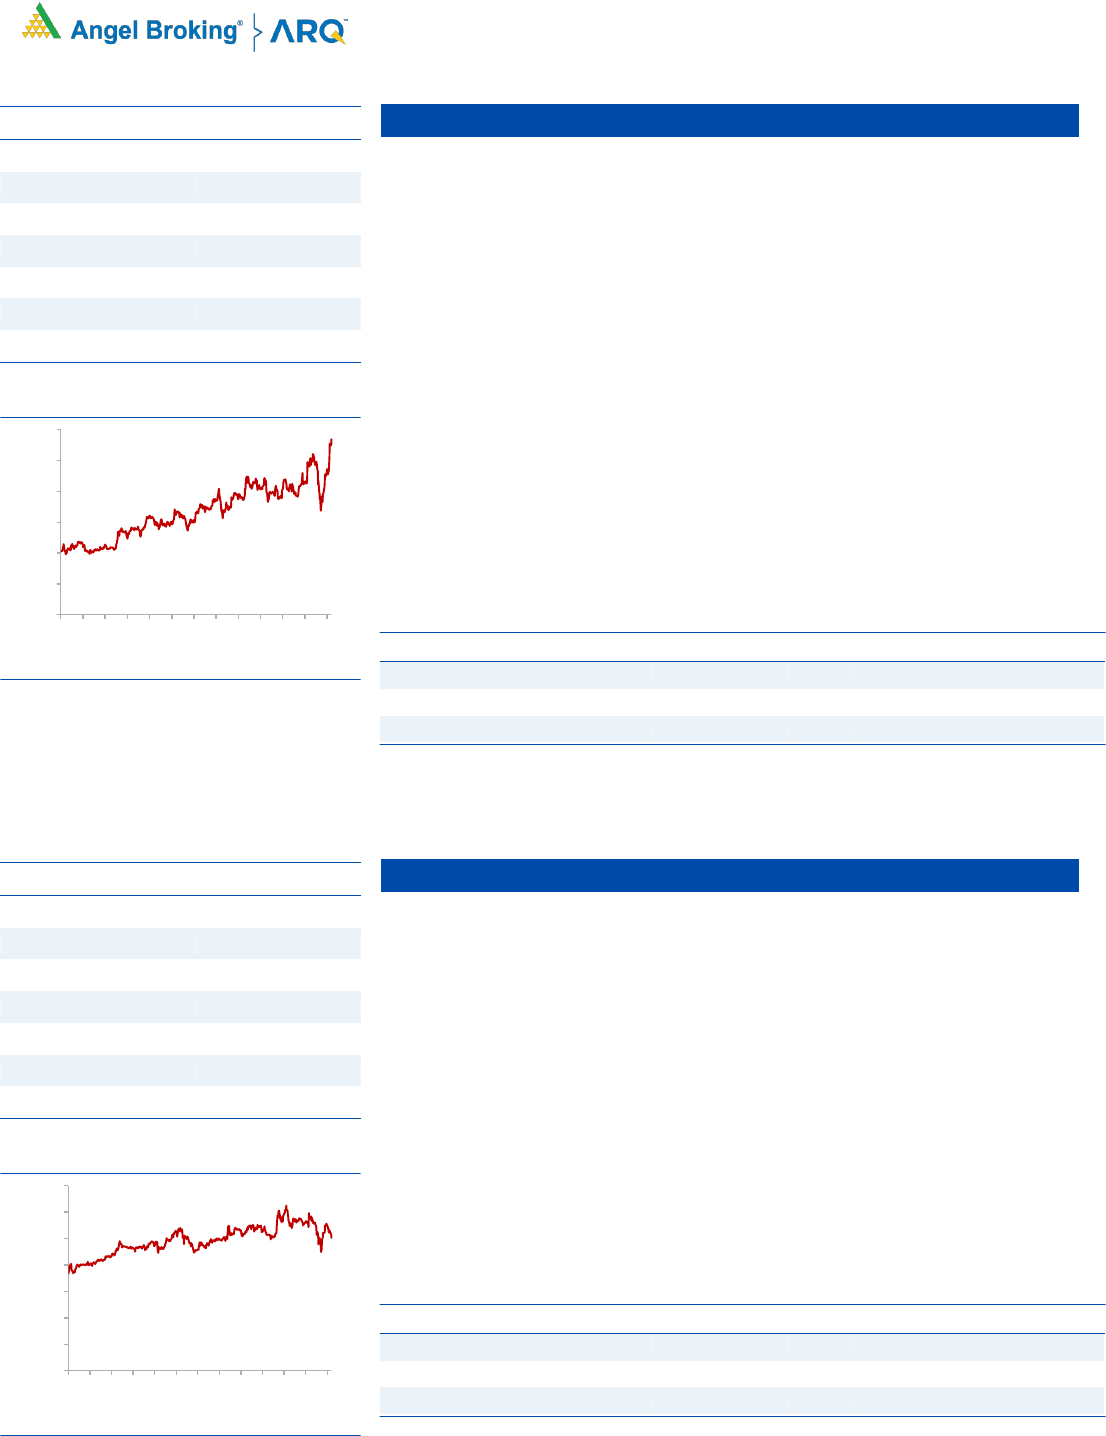
Stock Info
CMP
1,266
TP
1,561
Upside
23.3%
Sector
Footwear
Market Cap (` cr)
16,283
Beta
0.9
52 Week High / Low
1,897/1,017
3 year-Chart
Source: Company, Angel Research
-
200
400
600
800
1,000
1,200
1,400
1,600
1,800
2,000
May-17
Aug-17
Oct-17
Jan-18
Apr-18
Jul-18
Oct-18
Jan-19
Apr-19
Jul-19
Oct-19
Jan-20
Apr-20
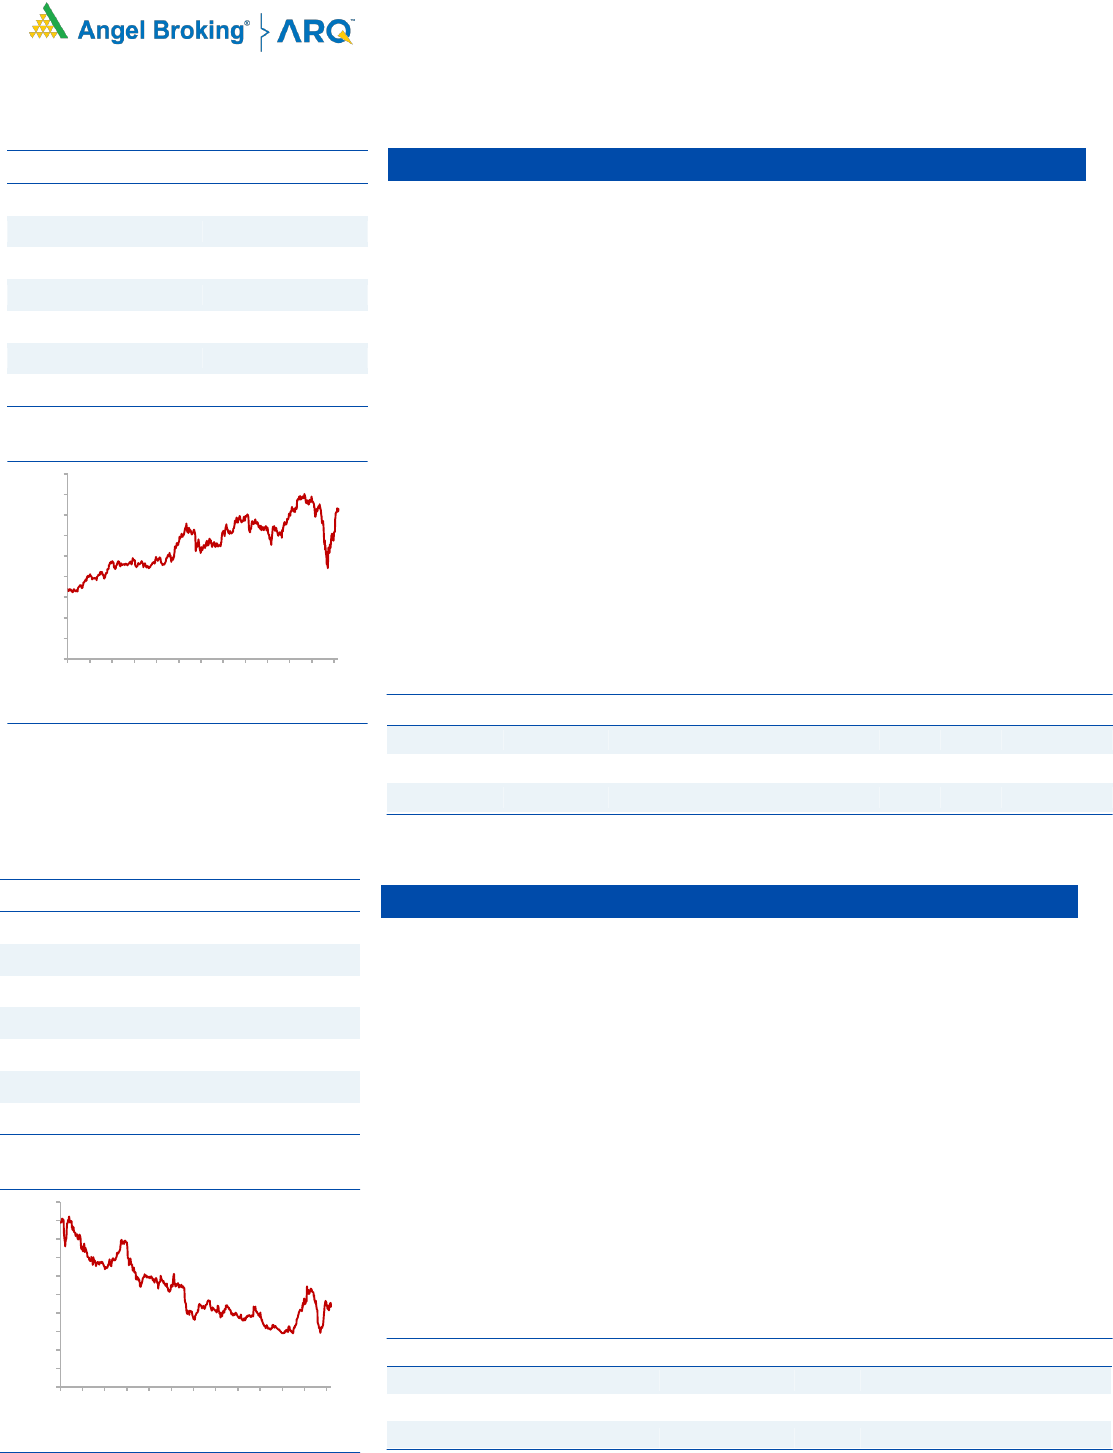
Stock Info
CMP
528
TP
594
Upside
12.5%
Sector
Telecom
Market Cap (` cr)
287,971
Beta
0.9
52 Week High / Low
569/312
3 year-Chart
Source: Company, Angel Research
-
100
200
300
400
500
600
May-17
Aug-17
Oct-17
Jan-18
Apr-18
Jul-18
Oct-18
Jan-19
Apr-19
Jul-19
Oct-19
Jan-20
Apr-20
5
Error!
Refer
ence
sourc
Angel Top Picks | May 2020
May 7, 2020
5
PI Industries Ltd.
PI Industries is a leading player in providing Custom synthesis and
manufacturing solutions (CSM) to global agrochemical players. The CSM
business accounted for 66% of the company’s revenues in FY19 and is
expected to be the key growth driver for the company in future
The company has been increasing its share of high margin CSM business
driven by strong relationship with global agrochemical players. PI is leveraging
its chemistry skill sets and is looking to diversify its CSM portfolio to electronic
chemicals, Pharma API, fluoro chemicals, etc. which will help drive business.
Though the company’s operations have been impacted due to the Covid-19
outbreak we expect that PI Industries would be amongst the least impacted in
the sector given that the company is a pure play agrochemical player which
are part of essential commodities.
Key Financials:
Y/E
Sales
OPM
PAT
EPS
ROE
P/E
P/BV
EV/Sales
March
(` cr)
(%)
(` cr)
(`)
(%)
(x)
(x)
(x)
FY2021E
3877
21.5
555
40.2
17.4
38.0
3.3
5.3
FY2022E
4992
22.5
770
55.8
20.0
27.4
2.7
4.1
Source: Company, Angel Research
Colgate-Palmolive (India)
Colgate-Palmolive India Ltd (CPIL) is engaged in manufacturing & selling of
oral care products such as toothpastes and toothbrushes.
CPIL has leadership position in both toothpastes (52% market share) and
toothbrushes (45% market share).
CPIL continuously invests on ad-spends to strengthen the Colgate brand.
Colgate is India’s No. 1 Most Trusted Oral Care Brand.
CPIL has increased its distribution 2.3x over the last 6-7 years and is
continuously making efforts to deepen its penetration.
We believe that CPIL should ultimately be able to see sharper market share
gain in toothpastes segment on the back of higher ad-spend and re-launch of
Colgate Strong Teeth (decent traction seen in last quarter).
Key Financials
Y/E
Sales
OPM
PAT
EPS
ROE
P/E
P/BV
EV/Sales
March
(` cr)
(%)
(` cr)
(`)
(%)
(x)
(x)
(x)
FY2021E
4827
27.4
855
31.7
40.4
43.7
17.8
7.7
FY2022E
5213
27.9
938
34.7
37.7
39.9
15.1
7.2
Source: Company, Angel Research
Stock Info
CMP
1,343
TP
1,772
Upside
31.9%
Sector
FMCG
Market Cap (` cr)
36,545
Beta
0.6
52 Week High / Low
1,642/1,065
3 year-Chart
Source: Company, Angel Research
-
200
400
600
800
1,000
1,200
1,400
1,600
1,800
May-17
Aug-17
Oct-17
Jan-18
Apr-18
Jul-18
Oct-18
Jan-19
Apr-19
Jul-19
Oct-19
Jan-20
Apr-20
Stock Info
CMP
1,529
TP
1,785
Upside
16.7%
Sector
Agro Chemicals
Market Cap (` cr)
21,126
Beta
0.8
52 Week High / Low
1,626/974
3 year-Chart
Source: Company, Angel Research
-
200
400
600
800
1,000
1,200
1,400
1,600
1,800
May-17
Aug-17
Oct-17
Jan-18
Apr-18
Jul-18
Oct-18
Jan-19
Apr-19
Jul-19
Oct-19
Jan-20
Apr-20
6
Error!
Refer
ence
sourc
Angel Top Picks | May 2020
May 7, 2020
6
Nestle (India)
Nestle India Ltd (Nestle) manufactures and sells a variety of food products
such as Milk & Nutrition, Prepared Dishes & Cooking Aids, Powdered & Liquid
Beverages and Confectionery.
Nestle enjoys market leadership position in ~85% of its Portfolio. Nestle has
wide distribution network (4.6mn outlets) across India and strong brand recall.
Strong balance sheet coupled with free cash flow and higher profitability.
Going forward, we expect healthy growth and profitability on the back of
strong brand, wide distribution network and new product launches.
Key Financials
Y/E
Sales
OPM
PAT
EPS
ROE
P/E
P/BV
EV/Sales
March
(` cr)
(%)
(` cr)
(`)
(x)
(%)
(%)
(x)
CY2021E
13235
23.3
2151
223.0
66.9
67.7
52.3
12.6
CY2022E
14558
23.4
2382
247.0
50.4
61.2
35.6
11.5
Source: Company, Angel Research
Galaxy Surfactants
Galaxy Surfactants is a market leader in oleo chemical-based surfactants,
which is used in personal and home care products including skin care, oral
care, hair care, cosmetics, toiletries and detergent products.
The company has been increasing its share of high margin specialty care
products in its portfolio which now accounts for ~ 40% of its revenues while
the balance is accounted for by the performance surfactant business.
Company has very strong relationship with MNC clients like Unilever, P&G,
Henkel, Colgate-Palmolive and supplies raw materials to them not only in
India but also in US, EU and MENA region.
Though the company’s operations have been impacted due to the Covid-19
outbreak we expect that Galaxy Surfactants would be amongst the least
impacted in the sector given the company’s exposure to the personal and
home care segment.
Key Financials
Y/E
Sales
OPM
PAT
EPS
ROE
P/E
P/BV
EV/Sales
March
(` cr)
(%)
(` cr)
(`)
(%)
(x)
(x)
(x)
FY2021E
2672
3.0
221
62.2
0.2
21.6
4.0
1.8
FY2022E
2886
8.0
223
62.8
0.2
19.4
3.5
1.7
Source: Company, Angel Research
Stock Info
CMP
1,356
TP
1,610
Upside
18.7%
Sector
Chemicals
Market Cap (` cr)
4,806
Beta
0.6
52 Week High / Low
1,790/975
3 year-Chart
Source: Company, Angel Research
-
200
400
600
800
1,000
1,200
1,400
1,600
1,800
Feb-18
May-18
Aug-18
Nov-18
Feb-19
May-19
Aug-19
Oct-19
Jan-20
Apr-20
Stock Info
CMP
17,420
TP
20,687
Upside
18.8%
Sector
FMCG
Market Cap (` cr)
167,957
Beta
0.7
52 Week High / Low
18,301/10,127
3 year-Chart
Source: Company, Angel Research
-
2,000
4,000
6,000
8,000
10,000
12,000
14,000
16,000
18,000
20,000
May-17
Aug-17
Oct-17
Jan-18
Apr-18
Jul-18
Oct-18
Jan-19
Apr-19
Jul-19
Oct-19
Jan-20
Apr-20
7
Error!
Refer
ence
sourc
Angel Top Picks | May 2020
May 7, 2020
7
IPCA Laboratories
IPCA’s 54% of revenue comes from domestic generic and API business.
Generics and API continues to provide revenue growth for Ipca. Expected to
outperform the Indian Pharmaceutical market (IPM) by 8%-10% p.a in FY 22.
EU generic & branded which account for 15% of the company’s revenues are
on growth trajectory along with higher margins (40% EBITDA margins).
Current capacity utilization of plants which supply to Europe is at 20% which is
expected to ramp up from current levels. We expect the European business to
show 30-35% PAT growth.
Ipca manufacture over 350 formulations and 80 APIs for various therapeutic
segments like Pain management. Currently the company has 18 ANDA
sapprovals, 46 ANDA filled with authorities while 8 products are in clinical
trials.
Britannia Industries
Britannia Industries (BRIT)’s principal activity is manufacture and sale of
biscuits, bread, rusk, cakes and dairy products.
BRIT has brands like Tiger, Good-Day, and 50:50 under its fold with an
estimated market share of 33% in the Indian biscuits industry. Biscuits
contribute more than 80% of the company’s turnover.
BRIT has an overall distribution reach of 5.5 million outlets. With consistent
focus on distribution expansion, BRIT has narrowed the gap with the No. 1
player. The gap with largest distributed brand is now just 0.8 million outlets,
which it expects to bridge soon and thereby, become the largest player over
the medium to long term.
Stock info
CMP
1,575
TP
1,900
Upside
20.6%
Sector
Pharmaceuticals
Market Cap (` cr)
19,578
Beta
0.4
52 Week High / Low
1,821/844
3 year-Chart
Source: Company, Angel Research
Key Financials
Y/E
Sales
OPM
PAT
EPS
ROE
P/E
P/BV
EV/Sales
March
(` cr)
(%)
(` cr)
(`)
(%)
(x)
(x)
(x)
FY2021E
5360
22.5%
821
65.7
18.8
24.6
4.8
3.9
FY2022E
6111
23.0
976
78.1
18.6
20.7
4.1
3.4
Source: Company, Angel Research
Stock Info
CMP
2,978
TP
3,550
Upside
19.2%
Sector
FMCG
Market Cap (` cr)
71,630
Beta
1.0
52 Week High / Low
3,444/2,100
3 year-Chart
Source: Company, Angel Research
Key Financials
Y/E
Sales
OPM
PAT
EPS
ROE
P/E
P/BV
EV/Sales
March
(` cr)
(%)
(` cr)
(`)
(%)
(x)
(x)
(x)
FY2021E
13,255
16.3
1622
67.5
30.2
44.4
12.7
9.3
FY2022E
14,863
16.7
1901
78.8
29.6
37.9
9.8
8.3
Source: Company, Angel Research
-
200
400
600
800
1,000
1,200
1,400
1,600
1,800
May-17
Aug-17
Oct-17
Jan-18
Apr-18
Jul-18
Oct-18
Jan-19
Apr-19
Jul-19
Oct-19
Jan-20
Apr-20
-
500
1,000
1,500
2,000
2,500
3,000
3,500
4,000
May-17
Aug-17
Oct-17
Jan-18
Apr-18
Jul-18
Oct-18
Jan-19
Apr-19
Jul-19
Oct-19
Jan-20
Apr-20
8
Error!
Refer
ence
sourc
Angel Top Picks | May 2020
May 7, 2020
8
Alkem Laboratories
Alkem’s 67% of revenue comes from domestic generic and API business. Anti-
infective and Chronic business continues to provide revenue growth for Alkem.
Expected to outperform the Indian Pharmaceutical market (IPM) by 1.5x
growth rate for the next 2 years.
Company is ranked number one in Anti-infective with a market share of 9.6%,
Anti-infective is one of the oldest therapy for Alkem. Anti-diabetic, Vitamins,
CNS and derma are the key therapy products for Alkem
Company has incurred large capex in infrastructure and MR team in the last
couple of years, which will give organic growth to Alkem. At present the
company has 11400 MRs with the productivity of 45lakhs PA
New product launches and volume growth will help US business to grow by
15% p.a for next couple of years. Currently, Alkem has 81 approved ANDA
out of which 40 yet to be commercialized
Infosys
Infosys is amongst the top three IT services company based out of India and
provides a vast gamut of services like ADM, Enterprise solutions, Infrastructure
management services etc.
Under the new management of Mr. Salil Parekh Infosys has become
aggressive in terms of signing new deals, which is expected to drive growth for
the company. New deal wins has clearly accelerated with the company
winning deals worth USD 6.3bn and USD 9.0bn in FY19 & FY20 respectively
as against deal wins of USD 3.1bn in FY18.
We expect the company to post revenue/EBITDA/PAT growth of
7.5%/3.7%/5.1% between FY19-FY22 despite Covid-19 outbreak affecting
FY21 numbers. Rupee depreciation from ~71 levels to ~76 to the US dollar
will have a positive impact on top line and bottom-line and will mitigate the
adverse impact due to Covid-19 outbreak to a large extent.
Stock Info
CMP
2,670
TP
3,300
Upside
23.6%
Sector
Pharmaceuticals
Market Cap (` cr)
31,923
Beta
0.3
52 Week High / Low
2,882/1660
3 year-Chart
Source: Company, Angel Research
Key Financials
Y/E
Sales
OPM
PAT
EPS
ROE
P/E
P/BV
EV/Sales
March
(` cr)
(%)
(` cr)
(`)
(%)
(x)
(x)
(x)
FY2021E
9860
17.5%
1279
106.0
18.3
25.1
4.8
2.6
FY2022E
11309
18%
1419
118.0
17.8
22.6
4.5
2.3
Source: Company, Angel Research
Stock Info
CMP
675
TP
841
Upside
24.6%
Sector
IT
Market Cap (` cr)
21,125
Beta
0.8
52 Week High / Low
847/511
3 year-Chart
Source: Company, Angel Research
Key Financials
Y/E
Sales
OPM
PAT
EPS
ROE
P/E
P/BV
EV/Sales
March
(` cr)
(%)
(` cr)
(`)
(%)
(x)
(x)
(x)
FY2021E
90650
21.3
16200
38.2
28.1
16.8
4.7
2.8
FY2022E
102857
20.5
17870
42.1
30.5
15.2
4.5
2.5
Source: Company, Angel Research
-
500
1,000
1,500
2,000
2,500
3,000
May-17
Aug-17
Oct-17
Jan-18
Apr-18
Jul-18
Oct-18
Jan-19
Apr-19
Jul-19
Oct-19
Jan-20
Apr-20
-
100
200
300
400
500
600
700
800
900
May-17
Aug-17
Oct-17
Jan-18
Apr-18
Jul-18
Oct-18
Jan-19
Apr-19
Jul-19
Oct-19
Jan-20
Apr-20
10
Error!
Refer
ence
sourc
Angel Top Picks | May 2020
May 7, 2020
10
Aarti Industries
Aarti Industries is the lowest cost producer in Benzene based derivatives.
Company accounts for 20% of world’s Nitrochloro Benzene (NCB) and 10% of
dichloride benzene (DCB) capacity.
Company has been constantly increasing it’s share of high margin
downstream products which now accounts for 70% of the company’s
revenues. Company is expanding it’s NCB capacity which would be utilized for
manufacture of high margins downstream products.
Company is well diversified across product, customer, geography and end
user industry and is not likely to be impacted too much from the Covid-19
outbreak. Exports account for 40% of revenues while balance 60% is from
domestic sales. Significant opportunity for company arising from
environmental related issues in China and companies looking to diversify
supply chains.
P&G Hygiene & Healthcare Ltd.
P&GHH manufactures, distributes and markets three major brands in India –
Whisper (sanitary napkins), Vicks (balm, cough drops and tablets), and Old
Spice (aftershave lotion and deodorants).
Whisper being market leader with market share of 56% in Sanitary pad
segment contributes ~69% of total revenue. Sanitary Pads having less than
20% market penetration leaves immense growth opportunity for Whisper. icks
beings market leader with market share of ~30% contributes 30% of Total
Revenue.
Going forward, we expect healthy growth and profitability on the back of
strong brand, wide distribution network and new product launches.
Stock Info
CMP
1,138
TP
1,284
Upside
12.8%
Sector
Chemicals
Market Cap (` cr)
19,834
Beta
0.8
52 Week High / Low
1,192/662
3 year-Chart
Source: Company, Angel Research
Key Financials
Y/E
Sales
OPM
PAT
EPS
ROE
P/E
P/BV
EV/Sales
March
(` cr)
(%)
(` cr)
(`)
(%)
(x)
(x)
(x)
FY2021E
4822
21.7
538
30.3
16.8
37.6
6.0
4.1
FY2022E
5886
22.2
711
40.1
19.6
28.4
5.2
3.3
Source: Company, Angel Research
Stock Info
CMP
10,063
TP
12,230
Upside
21.5%
Sector
FMCG
Market Cap (` cr)
32,666
Beta
0.4
52 Week High / Low
12,700/8,500
3 year-Chart
Source: Company, Angel Research
Key Financials
Y/E
Sales
OPM
PAT
EPS
ROE
P/E
P/BV
EV/Sales
March
(` cr)
(%)
(` cr)
(`)
(%)
(x)
(x)
(x)
FY2021E
3472
24.6
596.0
183.5
29.0
54.9
15.9
9.6
FY2022E
3889
24.7
670.0
206.3
24.6
48.7
12.0
8.5
Source: Company, Angel Research
-
200
400
600
800
1,000
1,200
May-17
Aug-17
Oct-17
Jan-18
Apr-18
Jul-18
Oct-18
Jan-19
Apr-19
Jul-19
Oct-19
Jan-20
Apr-20
-
2,000
4,000
6,000
8,000
10,000
12,000
14,000
May-17
Aug-17
Oct-17
Jan-18
Apr-18
Jul-18
Oct-18
Jan-19
Apr-19
Jul-19
Oct-19
Jan-20
Apr-20
11
Error!
Refer
ence
sourc
Angel Top Picks | May 2020
May 7, 2020
11
Reliance Industries
Reliance Industries Ltd. (RIL) is India’s largest company with dominant
presence in Refining, Petrochemicals, Telecom and Retail businesses.
RIL has built up a dominant telecom business and has already attained market
leader status with 38.5 cr. subscribers at the end of Q3FY20. Telecom
business to witness robust growth over next few years due to tariff hikes and
shift of subscribers from Vodafone Idea to other telecom players.
RIL has also built a very strong retail business which is the largest organized
retailing company in India. We expect the retail business to be a key value
driver for Reliance over the long run though there would be some impact on
business in FY21 due to the Covid 9 outbreak.
Refining and petrochemicals business would be a stable low growth business
for RIL going forward but will be a major cash generator for the company as
there will be negligible capex requirements. The cash flows would be used to
fund expansion into other businesses.
Dhanuka Agritech
Dhanuka Agritech is a 100% domestic market focused Agrochemical
Company. It has an asset light business model with a clear focus on marketing
and creating brands. It has international collaboration with the world’s nine
leading agro chemical companies to introduce latest technology in Indian fa
Whisper It has a pan India presence with ~7,000 distributors & ~80,000
dealers. IMD forecasts of normal monsoon bode well for its business.
Coronavirus impact on business is minimal as it falls under essential service.
Company has better return ratios, working capital cycle and cash flow
compared to its peers. We are positive on the long term prospects of the
company owing to high industry growth rate, management capability and
wide & diversified product portfolio as well as reach.
Stock Info
CMP
1,461
TP
1,626
Upside
11.3%
Sector
Diversified
Market Cap (` cr)
926,176
Beta
1.1
52 Week High / Low
1,617/875
3 year-Chart
Source: Company, Angel Research
Key Financials
Y/E
Sales
OPM
PAT
EPS
ROE
P/E
P/BV
EV/Sales
March
(` cr)
(%)
(` cr)
(`)
(%)
(x)
(x)
(x)
FY2021E
373215
13.8
30272
59.2
6.4
30.6
2.0
5.0
FY2022E
457539
13.3
37510
47.8
7.8
24.7
1.9
4.0
Source: Company, Angel Research
Stock Info
CMP
434
TP
520
Upside
19.8%
Sector
Agro Chemicals
Market Cap (` cr)
2,065
Beta
0.8
52 Week High / Low
566/261
3 year-Chart
Source: Company, Angel Research
Key Financials
Y/E
Sales
OPM
PAT
EPS
ROE
P/E
P/BV
EV/Sales
March
(` cr)
(%)
(` cr)
(`)
(%)
(x)
(x)
(x)
FY2021E
1218
16.0
150
31.4
22.6
13.8
3.0
1.7
FY2022E
1304
16.4
165
34.6
22.8
12.5
2.7
1.6
Source: Company, Angel Research
-
200
400
600
800
1,000
1,200
1,400
1,600
1,800
May-17
Aug-17
Oct-17
Jan-18
Apr-18
Jul-18
Oct-18
Jan-19
Apr-19
Jul-19
Oct-19
Jan-20
Apr-20
-
100
200
300
400
500
600
700
800
900
1,000
May-17
Aug-17
Oct-17
Jan-18
Apr-18
Jul-18
Oct-18
Jan-19
Apr-19
Jul-19
Oct-19
Jan-20
Apr-20
9
Error!
Refer
ence
sourc
Angel Top Picks | May 2020
May 7, 2020
9
L&T Infotech
L&T InfoTech (LTI) is one of the fastest growing mid cap IT Company in India.
IT is part of the L&T group and provides services like ADM, Enterprise
solutions, Infrastructure management services etc.
Company has a very strong presence to the BFSI & manufacturing verticals,
which accounts for ~45% and 17.5% of the company’s revenues and are
amongst the least impacted vertical due to the shutdown on account of Covid -
19. The company doesn't have a very large exposure to service oriented
verticals like travel & Tourism which are amongst the worst impacted due to
the Covid – 19 outbreak
LTI has been growing significantly faster than both mid and large cap peers
have over the past few years on the back of strong deal wins and we expect
the outperformance to continue for the company.
Stock Info
CMP
1,529
TP
1,803
Upside
17.9%
Sector
IT
Market Cap (` cr)
26,687
Beta
0.7
52 Week High / Low
2,050/1207
3 year-Chart
Source: Company, Angel Research
Key Financials
Y/E
Sales
OPM
PAT
EPS
ROE
P/E
P/BV
EV/Sales
March
(` cr)
(%)
(` cr)
(`)
(%)
(x)
(x)
(x)
FY2021E
11304
18.1
1479.2
85.0
0.2
18.0
3.9
2.1
FY2022E
12631
19.0
1742.9
100.2
0.2
15.3
3.3
1.8
Source: Company, Angel Research
-
500
1,000
1,500
2,000
2,500
May-17
Aug-17
Oct-17
Jan-18
Apr-18
Jul-18
Oct-18
Jan-19
Apr-19
Jul-19
Oct-19
Jan-20
Apr-20

12
Error!
Refer
ence
sourc
Angel Top Picks | May 2020
May 7, 2020
12
Changes in Recommendation
Stocks on hold
Hold Date
Stock name
Hold Price
5/10/2019
Jindal Steel
94
1/4/2020
GMM Pfaudler
2,498
Stocks sold in last 6 months
Effective date
Stock
Sell Price
6/11/2019
M&M
580
8/11/2019
TTK Prestige
6,075
29/11/2019
Yes Bank
65
6/12/2019
Ashok Leyland
76
9/12/2019
Blue star
813
21/01/2020
HDFC Bank
1,246
27/01/2020
Siyaram Silk Mills
229
28/01/2020
Maruti Suzuki
7,065
29/01/2020
Music Broadcast
29
30/01/2020
GIC Housing
154
1/2/2020
Parag Food Milks
137
7/2/2020
Bata India
1,856
25/02/2020
Larsen & Tourbo
1,250
6/3/2020
Aditya Birla Capital
75
9/3/2020
Dr Lal Pathlabs
1,462
15/4/2020
RBL Bank
121
15/4/2020
Shriram Transport Finance
685
16/4/2020
Safari Industries
402
16/4/2020
KEI Industries
279
16/4/2020
Amber Enterprises
1,116
21/4/2020
Ultratech Cement
3,409
24/4/2020
Inox Wind
27
4/5/2020
Hindustan Unilever
2,121
5/5/2020
ICICI Bank
340
6/5/2020
Dabur India
450
7/5/2020
Asian Paints
1,610
Hold – While we recommend to Hold on to existing positions at current level, we would await
for further data points before recommending any fresh purchases.

13
Error!
Refer
ence
sourc
Angel Top Picks | May 2020
May 7, 2020
13
Research Team Tel: 022 - 39357800 E-mail: [email protected] Website: www.angelbroking.com
DISCLAIMER
Angel Broking Limited (hereinafter referred to as “Angel”) is a registered Member of National Stock Exchange of India Limited, Bombay
Stock Exchange Limited, Metropolitan Stock Exchange Limited, Multi Commodity Exchange of India Ltd and National Commodity &
Derivatives Exchange Ltd It is also registered as a Depository Participant with CDSL and Portfolio Manager and Investment Adviser with
SEBI. It also has registration with AMFI as a Mutual Fund Distributor. Angel Broking Limited is a registered entity with SEBI for Research
Analyst in terms of SEBI (Research Analyst) Regulations, 2014 vide registration number INH000000164. Angel or its associates has not
been debarred/ suspended by SEBI or any other regulatory authority for accessing /dealing in securities Market. Angel or its
associates/analyst has not received any compensation / managed or co-managed public offering of securities of the company covered
by Analyst during the past twelve months.
This document is solely for the personal information of the recipient, and must not be singularly used as the basis of any investment
decision. Nothing in this document should be construed as investment or financial advice. Each recipient of this document should
make such investigations as they deem necessary to arrive at an independent evaluation of an investment in the securities of the
companies referred to in this document (including the merits and risks involved), and should consult their own advisors to determine
the merits and risks of such an investment.
Reports based on technical and derivative analysis center on studying charts of a stock's price movement, outstanding positions and
trading volume, as opposed to focusing on a company's fundamentals and, as such, may not match with a report on a company's
fundamentals. Investors are advised to refer the Fundamental and Technical Research Reports available on our website to evaluate the
contrary view, if any
The information in this document has been printed on the basis of publicly available information, internal data and other reliable
sources believed to be true, but we do not represent that it is accurate or complete and it should not be relied on as such, as this
document is for general guidance only. Angel Broking Limited or any of its affiliates/ group companies shall not be in any way
responsible for any loss or damage that may arise to any person from any inadvertent error in the information contained in this report.
Angel Broking Limited has not independently verified all the information contained within this document. Accordingly, we cannot testify,
nor make any representation or warranty, express or implied, to the accuracy, contents or data contained within this document. While
Angel Broking Limited endeavors to update on a reasonable basis the information discussed in this material, there may be regulatory,
compliance, or other reasons that prevent us from doing so.
This document is being supplied to you solely for your information, and its contents, information or data may not be reproduced,
redistributed or passed on, directly or indirectly.
Neither Angel Broking Limited, nor its directors, employees or affiliates shall be liable for any loss or damage that may arise from or in
connection with the use of this information.
Disclosure of Interest Statement
Top Picks
1. Financial interest of research analyst or Angel or his Associate or his relative
No
2. Ownership of 1% or more of the stock by research analyst or Angel or associates or
relatives
No
3. Served as an officer, director or employee of the company covered under Research
No
4. Broking relationship with company covered under Research
No
Ratings (Based on Expected Returns: Buy (> 15%) Accumulate (5% to 15%) Neutral (-5 to 5%)
Over 12 months investment period) Reduce (-5% to -15%) Sell (< -15%)
Hold (Fresh purchase not recommended)